MH-370 Forward Tracking
The last reported location for MH-370 from Malaysian military radar is N6.6381 E96.408 at 18:22UTC. If we assume some maximum ground speed for the next 78 minutes until the 19:40UTC satellite ping then the intersection of the maximum aircraft range from the time of the last radar contact until the 19:40UTC satellite ping will define the northernmost and southernmost points on the 19:40UTC ping ring that the aircraft could have reached. Effectively turning the 19:40UTC ping ring into an arc.
The following plot shows the possible positions for the aircraft at 19:40UTC as blue dots on the ping ring based on a maximum ground speed of 520kts from the time of the last radar contact. The blue dots in this plot along the ping ring are spaced 1 degree apart in bearing from the satellite sub-point at 19:40UTC.
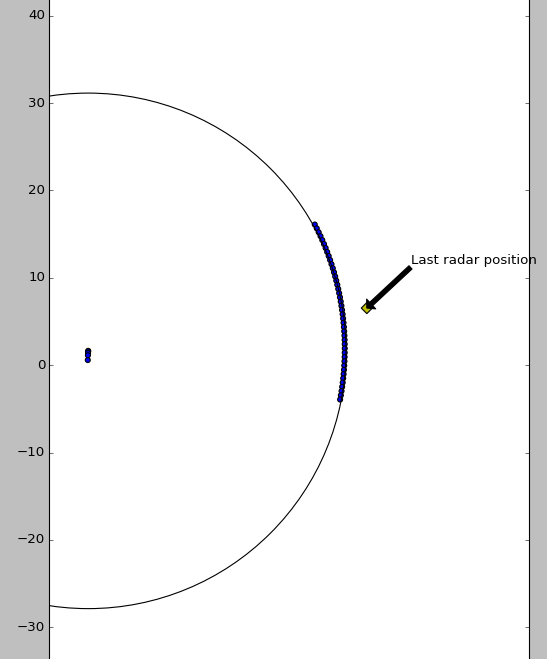
The subsequent 4 satellite pings at 20:40UTC, 21:40UTC, 22:40UTC and 00:11UTC show the aircraft being further away from the satellite at each ping.
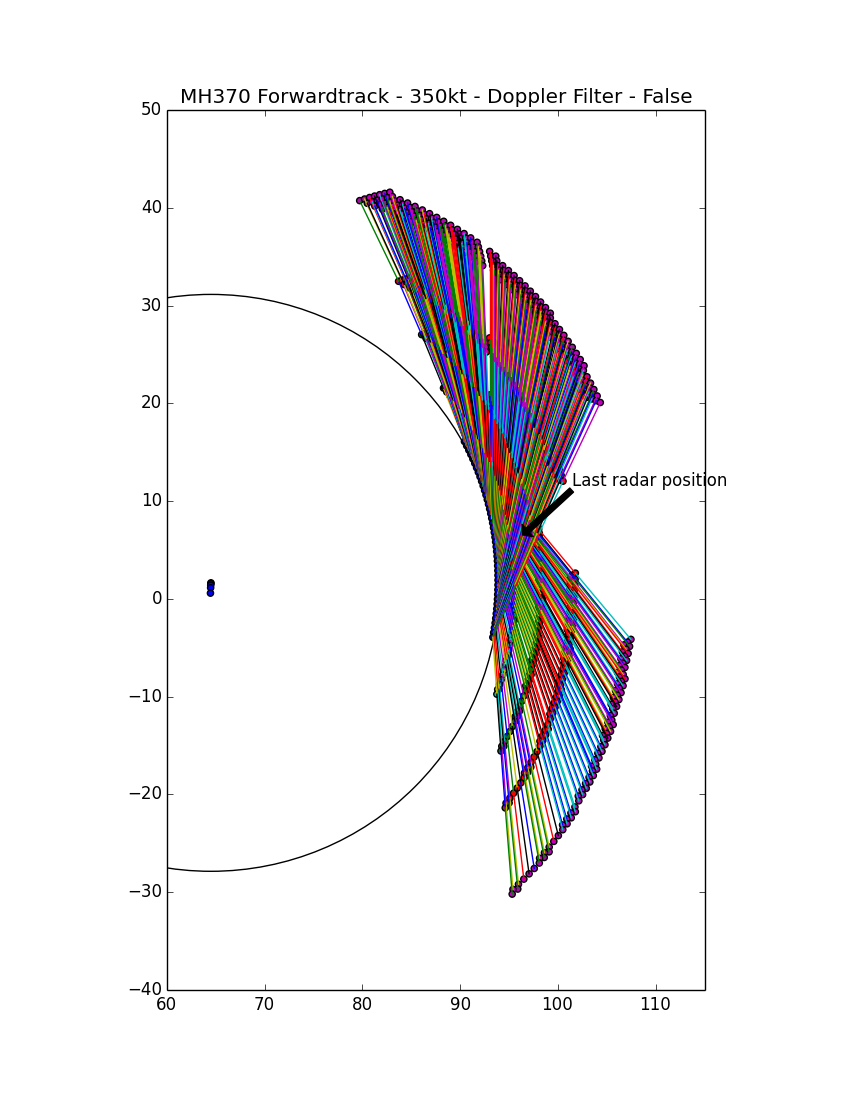
What I’ve done is to write a simple Python program that takes an assumed constant ground speed as input and then starting with each starting point indicated by the blue dots on the 19:40UTC ping arc tries to fit a projected ground track at that speed to all the subsequent ping rings.
It does that simply by for each starting point iterating over all possible ground tracks from 0-359 degrees in 1 degree increments and working out the resulting ground position at the time of each of the subsequent satellite pings. If there is a match to within a user defined error range, at the moment set at 4% then it plots that ground track.
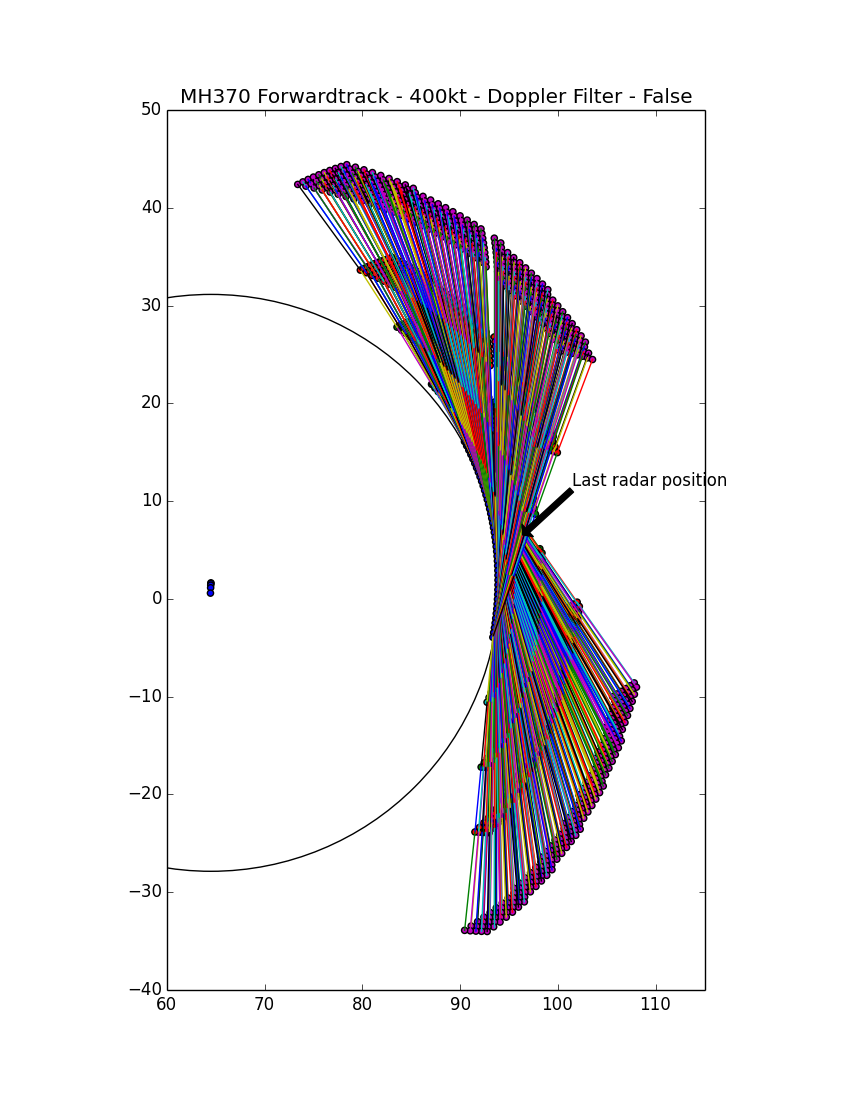
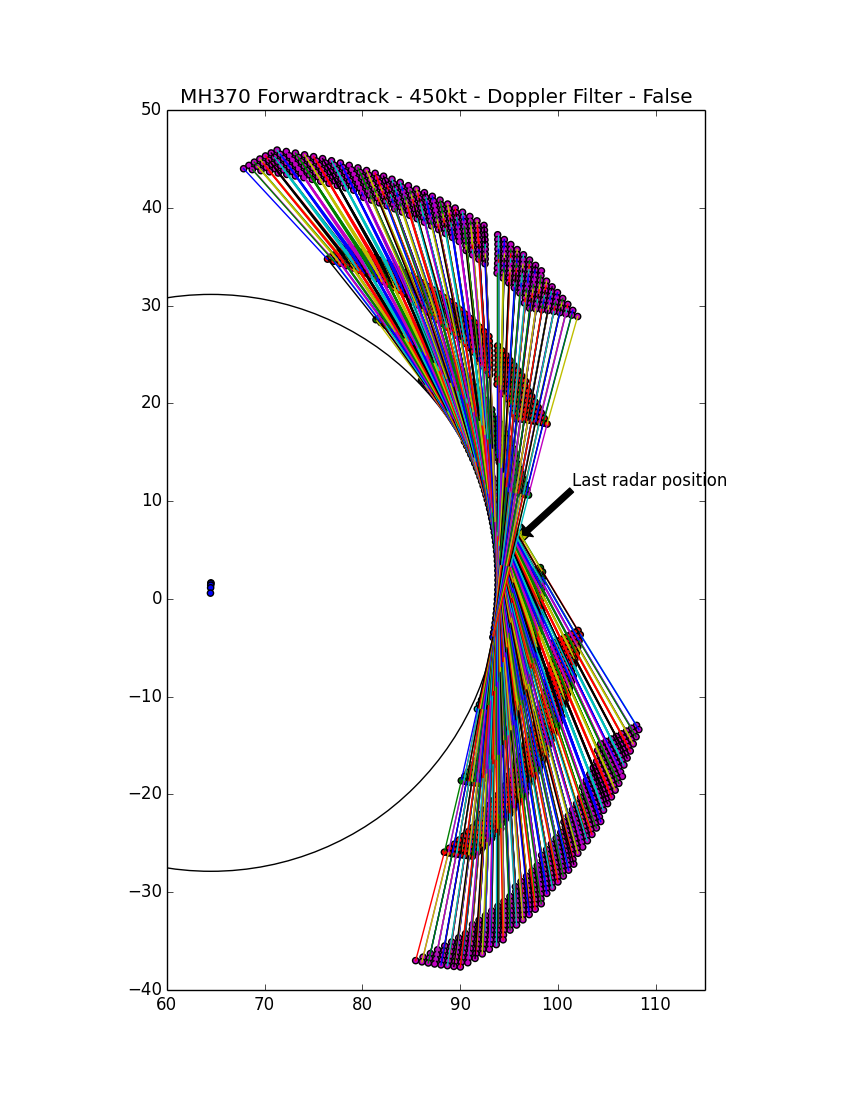
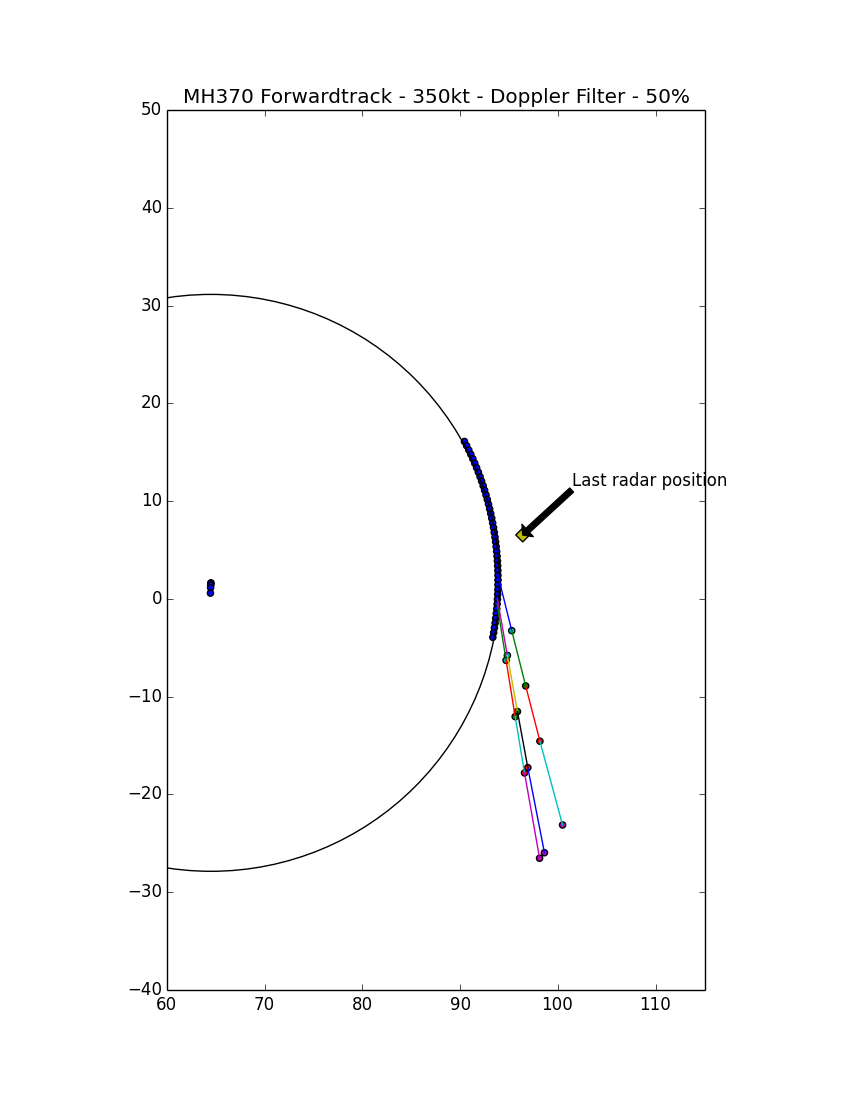
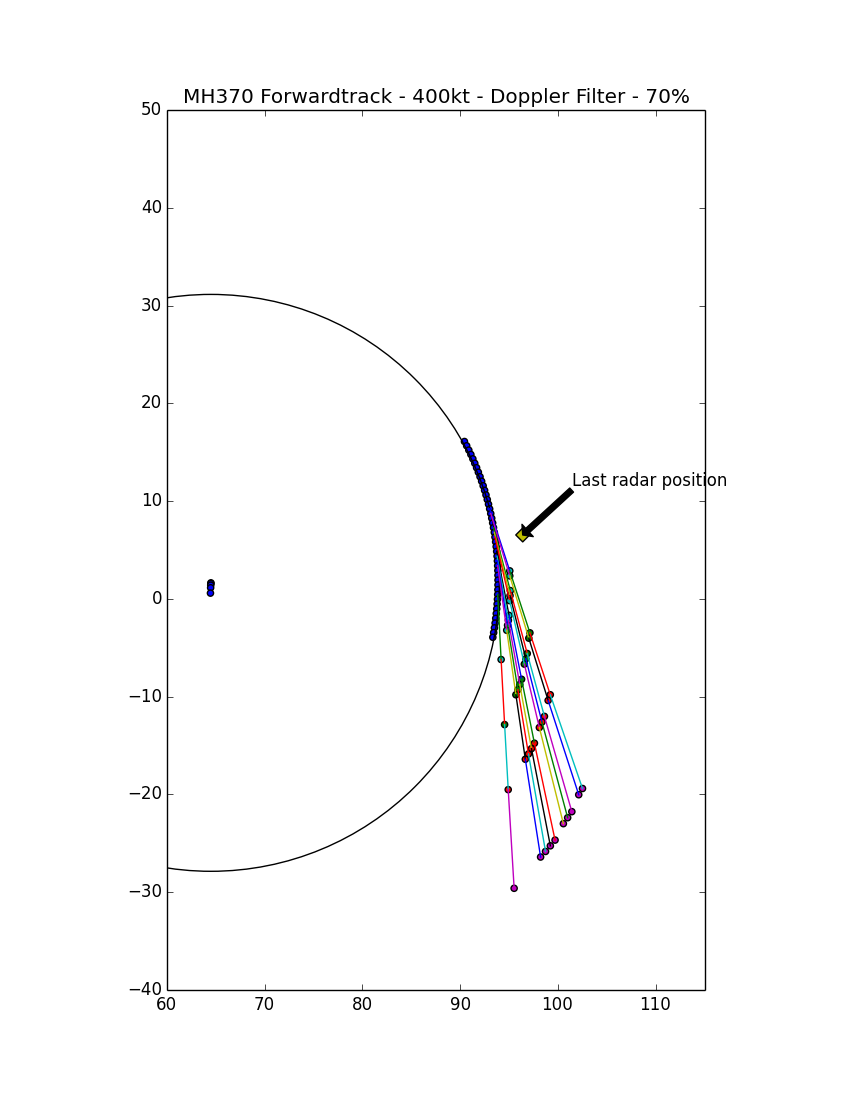
I’ve plotted the resulting possible ground tracks for 3 different ground speeds from 19:40UTC onwards, 350kt, 400kt and 450kt.
You can see why the initial ‘red arcs’ that Inmarsat released based on the 00:11UTC ping had a gap between them.
In addition to the being able to determine a range to the satellite for each ping Inmarsat also recorded the frequency change due to the Doppler effect at the time of each ping. The Doppler shift data in effect allows you to work out what the LOS (Line Of Sight) speed was between the aircraft’s position and velocity and the satellite’s position and velocity.
The authorities released a graph showing the BFO (Burst Frequency Offset) recorded for each satellite ping. Mike Exner with the help of Duncan Steele have converted these into LOS speeds for each ping.
So my idea was to then filter out the possible ground tracks shown in the plots above by only including those that also matched the Doppler data for each ping.
Given the satellite’s 3D position (SPx, SPy, SPz) and velocity (SVx, SVy, SVz) and the aircraft’s position (APx, APy, APz) and velocity (AVx, AVy, AVz) then the LOS speed between them can be calculated as follows.
$$P = \begin{pmatrix} SPx - APx\\ SPy - APy\\ SPz - APz \end{pmatrix}$$The following plots show the result of including the Doppler data to filter out ground tracks that don’t match both the satellite ping rings and the LOS speed derived from the Doppler data.
However unfortunately in order for any tracks to match based on the Doppler data I had to increase the error margin for the Doppler data to 50-95% compared to the 4% used for the ping ring positions.
The Doppler error margin used for each of the plots is included in the plot title, 50% for 350kt, 70% for 400kt and 95% for 450kt.
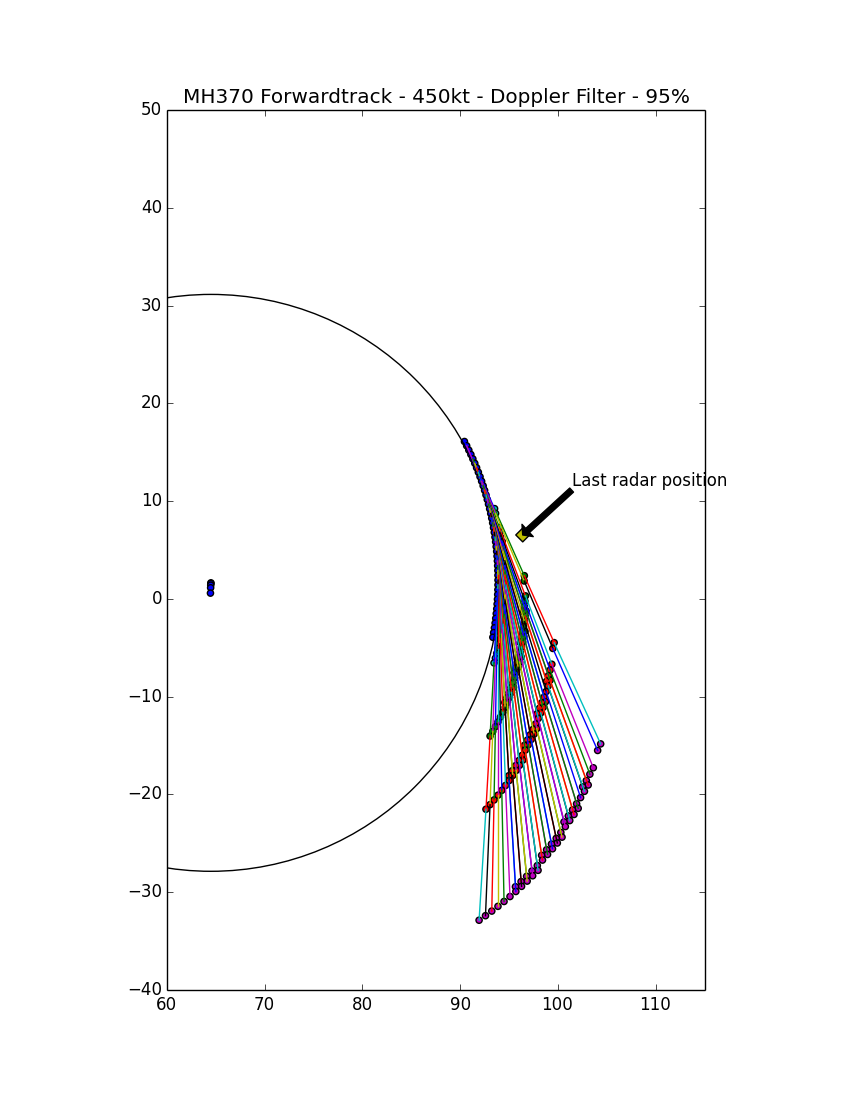
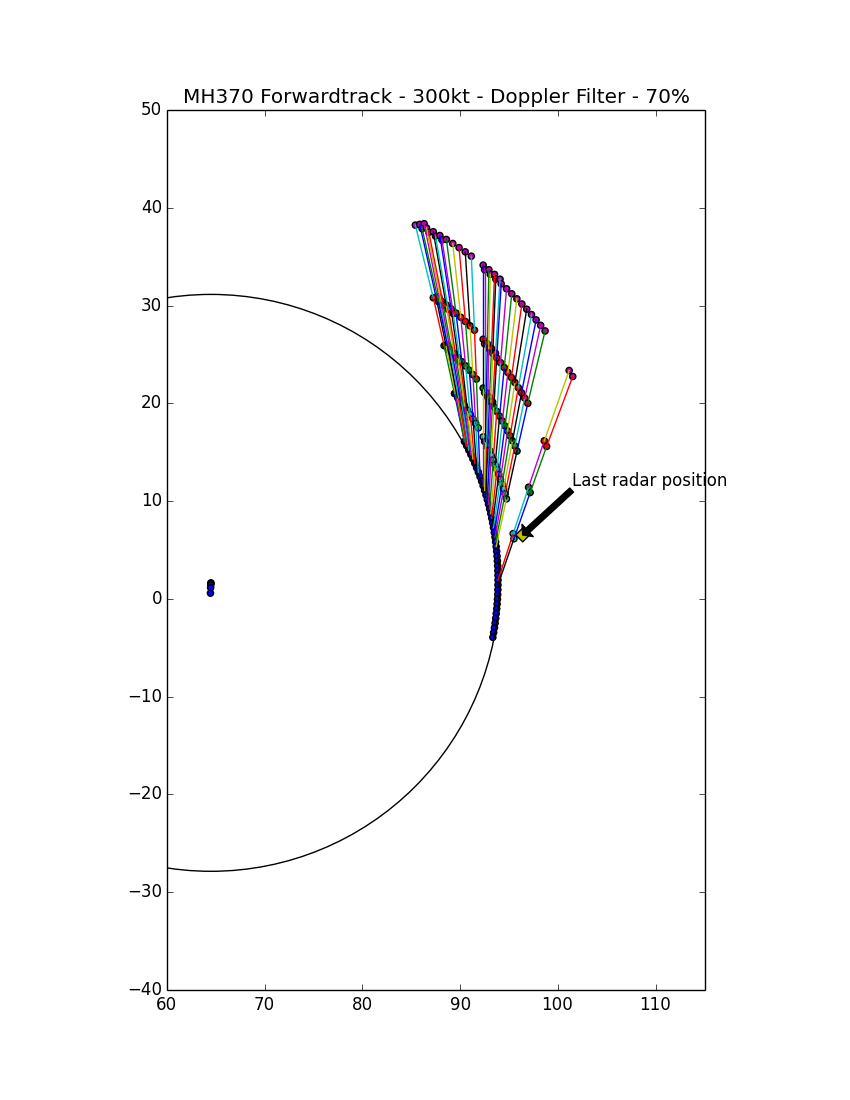
All three of the plots above only show southern routes matching both the ping rings and the Doppler data. However if I drop the ground speed to 300kt and use a Doppler error margin of 70% then some of the northern routes also match.
Given the need to use such large error margins for the Doppler data filtering I see 3 main possibilities.
-
I’ve made a mistake in some of the calculations in my program. Feel free to look at the source code and point any errors out.
-
I’ve made a typing error when entering some of the data into the program, e.g. the satellite co-ordinates, velocities etc. Again take a look at the source code and let me know if you spot any such errors.
-
The data I’m relying on isn’t accurate.
In terms of the data I’m relying on most of it has been derived by others rather than coming directly from the authorities. In terms of the ping ring ranges the authorities have only released the elevation angle of 40 degrees for the last ping at 00:11UTC. All the other ping ring ranges have been calculated by someone digitizing a plot that the authorities released showing a possible 450kt and 400kt route that the aircraft could’ve taken. The assumption being that the two possible ground tracks matched the ping ring range data that Inmarsat had.
The authorities haven’t released the LOS speeds based on the Doppler data for each of the pings. Instead they’ve only released a graph showing the Burst Frequency Offsets (BFO) recorded and others in particular Mike Exner have then tried to work backwards to calculate the LOS speed. However there is a lot of debate regarding the accuracy of this process mainly based on the assumptions used.
I’ve sourced all my data from Duncan Steele’s blog at www.duncansteel.com
In particular the satellite position and velocity data can be found at - www.duncansteel.com/archives/397
| Time | Ping Ring Range | LOS Speed |
|---|---|---|
| 19:40 UTC | 1762nm | -53.74kt |
| 20:40 UTC | 1805nm | -70.87kt |
| 21:40UTC | 1962nm | -84.20kt |
| 22:40UTC | 2199nm | -97.14kt |
| 00:11UTC | 2642nm | -111.18kt |
The source code for my program, only about 100 lines of Python can be found at - Python source code